Why monitoring web analytics is important
Web analytics is the practice of collecting, analyzing, and reporting website data to understand and optimize its usage. It provides valuable insights into user behavior, traffic sources, and overall website performance. Monitoring web analytics is important because it enables you to track the effectiveness of your website, identify areas for improvement, and ultimately drive more traffic and conversions to your website.
Without monitoring web analytics, you're essentially flying blind. You won't know how many people are visiting your website, where they're coming from, or what they're doing once they get there. This makes it impossible to make informed decisions about your website and optimize it for better performance. By monitoring web analytics, you can gain a deeper understanding of your audience, identify areas for improvement, and ultimately drive more traffic and conversions to your website.
Key performance indicators (KPIs) to track
Key performance indicators (KPIs) are metrics that are used to track and measure the performance of your website. There are many different KPIs that you can track in web analytics, but not all of them are equally important. The KPIs that you choose to track will depend on your specific goals and objectives.
For example, if your goal is to increase website traffic, you'll want to focus on metrics like traffic sources and page views per session. If your goal is to increase conversions, you'll want to focus on metrics like conversion rate and customer lifetime value. By tracking the right KPIs, you can gain valuable insights into the performance of your website and make informed decisions about how to optimize it for better results.
Key Performance Indicators (KPIs) Tracker & Tutorial
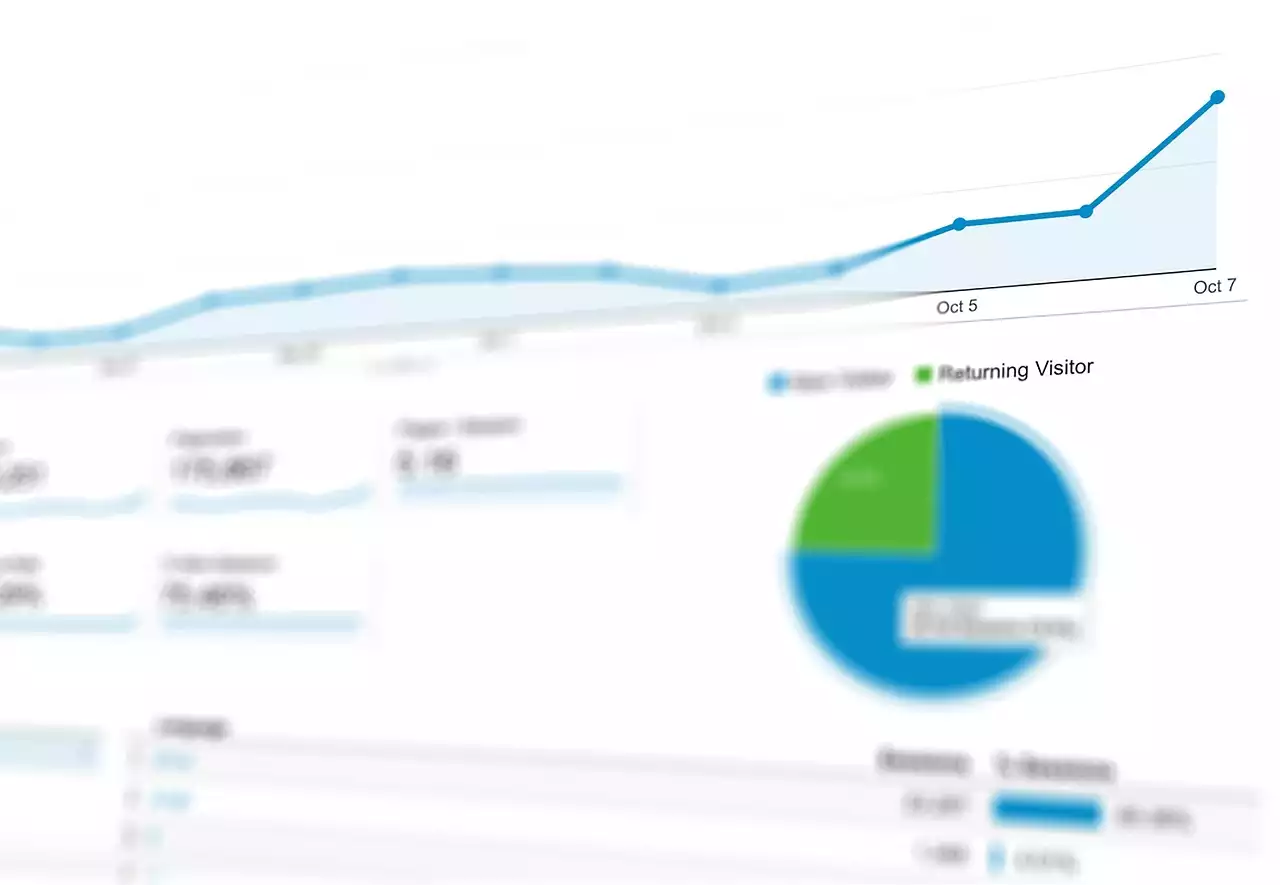
Metric 1: Traffic sources
One of the most important metrics to track in web analytics is traffic sources. This metric tells you where your website traffic is coming from. There are several different sources of traffic, including organic search, direct traffic, referral traffic, and social media traffic.
Organic search traffic comes from search engines like Google and Bing. Direct traffic comes from people who type your website URL directly into their browser. Referral traffic comes from other websites that link to your website. Social media traffic comes from social media platforms like Facebook, Twitter, and LinkedIn.
By tracking traffic sources, you can gain valuable insights into where your website traffic is coming from and which sources are driving the most traffic. This can help you optimize your website for better performance by focusing on the sources that are driving the most traffic.
Metric 2: Bounce rate
Bounce rate is another important metric to track in web analytics. Bounce rate is the percentage of visitors who leave your website after viewing only one page. A high bounce rate can indicate that your website isn't engaging or that your content isn't relevant to your audience.
By tracking bounce rate, you can gain valuable insights into the effectiveness of your website and identify areas for improvement. For example, if you have a high bounce rate on a particular page, you may need to improve the content or design of that page to make it more engaging.
Metric 3: Conversion rate
Conversion rate is the percentage of visitors who take a desired action on your website, such as making a purchase or filling out a form. Conversion rate is a critical metric to track because it directly affects your bottom line.
By tracking conversion rate, you can gain valuable insights into the effectiveness of your website and identify areas for improvement. For example, if you have a low conversion rate on a particular page, you may need to improve the call-to-action or the design of that page to make it more effective.
Metric 4: Average session duration
Average session duration is the average length of time that visitors spend on your website. This metric can give you insight into how engaged your audience is with your content.
By tracking average session duration, you can gain valuable insights into the effectiveness of your website and identify areas for improvement. For example, if you have a low average session duration, you may need to improve the quality or relevance of your content to keep visitors engaged for longer periods of time.
Metric 5: Page views per session
Page views per session is the average number of pages that visitors view during a single session on your website. This metric can give you insight into how engaged your audience is with your website.
By tracking page views per session, you can gain valuable insights into the effectiveness of your website and identify areas for improvement. For example, if you have a low page views per session, you may need to improve the navigation or layout of your website to encourage visitors to view more pages.
Metric 6: Exit rate
Exit rate is the percentage of visitors who leave your website from a particular page. This metric can give you insight into which pages are causing visitors to leave your website.
By tracking exit rate, you can gain valuable insights into the effectiveness of your website and identify areas for improvement. For example, if you have a high exit rate on a particular page, you may need to improve the content or design of that page to make it more engaging.
Metric 7: Time on page
Time on page is the length of time that visitors spend on a particular page of your website. This metric can give you insight into how engaged your audience is with your content.
By tracking time on page, you can gain valuable insights into the effectiveness of your website and identify areas for improvement. For example, if you have a low time on page for a particular page, you may need to improve the quality or relevance of your content to keep visitors engaged for longer periods of time.
Metric 8: Click-through rate (CTR)
Click-through rate (CTR) is the percentage of visitors who click on a particular link or call-to-action on your website. This metric can give you insight into how effective your calls-to-action are.
By tracking CTR, you can gain valuable insights into the effectiveness of your website and identify areas for improvement. For example, if you have a low CTR on a particular call-to-action, you may need to improve the visibility or wording of that call-to-action to make it more effective.
Metric 9: Return on investment (ROI)
Return on investment (ROI) is a financial metric that measures the return on a particular investment. When it comes to web analytics, ROI can be used to measure the return on your marketing efforts.
By tracking ROI, you can gain valuable insights into the effectiveness of your marketing efforts and identify areas for improvement. For example, if you have a low ROI on a particular marketing campaign, you may need to adjust your strategy or tactics to make it more effective.
Metric 10: Customer lifetime value (CLV)
Customer lifetime value (CLV) is a financial metric that measures the total value of a customer over their lifetime. When it comes to web analytics, CLV can be used to measure the value of your website visitors.
By tracking CLV, you can gain valuable insights into the value of your website visitors and identify areas for improvement. For example, if you have a low CLV for a particular segment of your audience, you may need to adjust your marketing or retention strategies to increase their value.
How to use these metrics to improve your website
Now that you know the top 10 metrics to monitor in web analytics, how can you use them to improve your website? Here are some tips:
1. Set goals: Before you start tracking metrics, it's important to set goals for your website. What do you want to achieve? By setting goals, you can focus on the metrics that matter most and make informed decisions about how to optimize your website for better results.
2. Identify areas for improvement: By regularly monitoring metrics, you can identify areas for improvement on your website. For example, if you have a high bounce rate on a particular page, you may need to improve the content or design of that page to make it more engaging.
3. Test and optimize: Once you've identified areas for improvement, it's important to test and optimize your website. Try different approaches and track the metrics to see what works best. By continually testing and optimizing, you can improve the performance of your website over time.